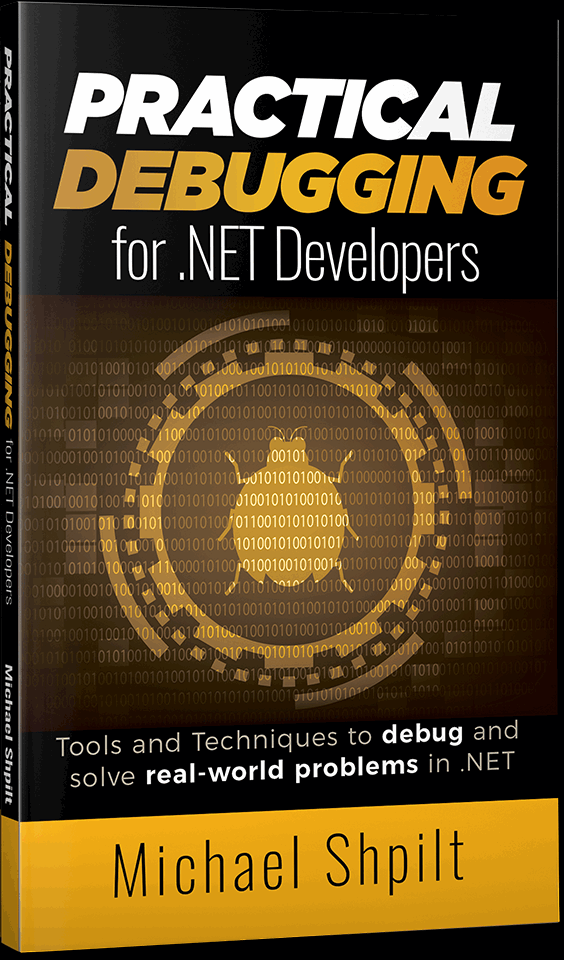
Practical Debugging for .NET Developers
Become an Expert Problem Solver
The ability to solve difficult problems is what makes a good engineer great. This book teaches tools and techniques for developers to tackle even the most persistent bugs. You’ll find that tough issues can be made simple with the right knowledge, tools, and practices. Practical Debugging for .NET Developers will transform you into the guy or gal who everyone turns to for help.
Issues covered include .NET Core, C#, Memory Leaks, Performance Problems, ASP.NET, Performance Counters, ETW Events, Production Debugging, Memory Pressure, Visual Studio, Hangs, Profiling, Deadlocks, Crashes, Memory Dumps, and Azure.
- Discover the best tools in the industry to diagnose and fix problems
- Learn advanced debugging techniques with Visual Studio
- Fix memory leaks and memory pressure issues
- Detect, profile, and fix performance problems
- Find the root cause of crashes and hangs
- Debug production code and third-party code
- Analyze ASP.NET applications for slow performance, failed requests, and hangs
- Use dump files, Performance Counters, and ETW events to investigate what happens under the hood
- Troubleshoot cloud environments, including Azure VMs and App Services
- Code samples in C#
- Covering .NET Core, .NET Framework, Windows, and Linux

Table of Contents
Introducing the most important tools in .NET space for analyzing and debugging problems.
General debugging strategies and techniques for any software root-cause analysis, not just .NET.
Diving into our primary debugging tool: Visual Studio. Including many advanced tips and lesser-known features
Going over one of the most valuable tools in .NET – Memory Dumps. When should Dumps be used, how to capture them, and how to analyze them. Including .NET Core Dumps on Linux.
How to investigate crashes in .NET and find the root cause
How to investigates hangs including Desktop app hangs and ASP.NET request hangs.
How to investigate memory issues. Learn to use memory profilers, performance counters, and other tools. Find and fix memory leaks. Detect and resolve GC pressure.
How to investigate performance issues. Learn to use performance profilers, performance counters, and ETW events with PerfView. Solve performance problems in production.
How to debug optimized code with no symbols or original source code. This might be a 3rd-party library or your own code in production.
How to investigate failed ASP.NET requests in your production environment. Includes .NET Framework, .NET Core, Windows or Linux.

About the author
In his blog, michaelscodingspot.com, Michael frequently writes about C#, debugging tools, .NET memory management, and performance optimizations.
Video Lessons
As I was writing this book, I realized many tools can be better explained in video, especially if you're using them for the first time. Sometimes, screenshots are just not going to cut it. To be able to give the best teaching experience possible, I ended up with 24 videos and over five hours of content.
12: Introduction to WinDbg (23:41)
13: Introduction to PerfView (20:37)
14: Windows Event Log and Event Viewer (4:57)
15: DebugView (4:17)
16: Process Explorer (5:46)
17: ILSpy (6:50)
18: Fiddler (12:01)
19: OzCode (15:15)
32: Visual Studio Tool Windows (21:59)
33: Visual Studio Exception Settings (24:36)
42: Debug dumps in WinDbg (10:36)
61: Debug Hangs in Visual Studio (09:58)
62: Debug Hangs in dotTrace (11:04)
71: Memory Profiling with SciTech’s .NET MemProfiler (14:27)
72: Find memory leaks with dotMemory (09:42)
73: Find memory leaks in Visual Studio (09:24)
81: Performance profiling with dotTrace (15:50)
82: Performance profiling with PerfView (30:19)
91: Debug production code with dotTrace and dnSpy (15:35)
92: Debug production code with Visual Studio (07:40)
Complete Digital Edition

eBook: The digital version in PDF, ePub, and Mobi formats.

Video Lessons: 24 videos demonstrating tool usage and advanced debugging techniques. Over 5 hours total of video material.

All code samples are available on GitHub.
E-Book Only

eBook: The digital version in PDF, ePub, and Mobi formats.

All code samples are available on GitHub.
Print book Only

The print book from Amazon

All code samples are available on GitHub.
Video lessons Only
If you got just the eBook or just the print book from Amazon, you can get the accompanying video lessons as well. The videos don’t replace the book and shouldn’t be consumed as a standalone product.

Video Lessons: 24 videos demonstrating tool usage and advanced debugging techniques. Over 5 hours total of video material.

All code examples with the debugging samples are available on GitHub.